The Fair Admissions Campaign’s map rates every mainstream state secondary school in England based on how socio-economically inclusive it is. It does this by comparing the number of pupils in the school who are eligible for free school meals (FSM) to the number of pupils in the school’s local area who are eligible, and finding the difference. The results are clear. Religiously selective schools are socio-economically selective.
But critics often allege that the comparison it makes looks at too local an area for each school – particularly as religiously selective schools take from a wider geographical area than other schools do. Instead the Church of England prefers to make national comparisons between different groups of schools, where the differences are smaller because of the fact that religious schools tend to be in cities, which have greater concentrations of poorer families than the national average. Such national comparisons are clearly comparing schools across too wide a geographical area, as no school takes pupils from across the nation.
The Catholic Education Service (CES), meanwhile, would rather look at an alternative measure, the Income Deprivation Affecting Children Index (IDACI), which shows that Catholic schools take more pupils from the most deprived areas. However, a simple analysis shows that the schools themselves are even more likely still to be in the most deprived areas, so all the CES is showing (once again) is that Catholic schools are more likely to be in cities than other schools. They are not showing that their schools are inclusive but in fact highlighting figures that, when explored fully, demonstrate quite the opposite.
But does the initial charge stand – are we looking too closely with our map? That is a claim we can test, and so test it we have.
The answer is no, we are not.
The context: comparing each school to its local area
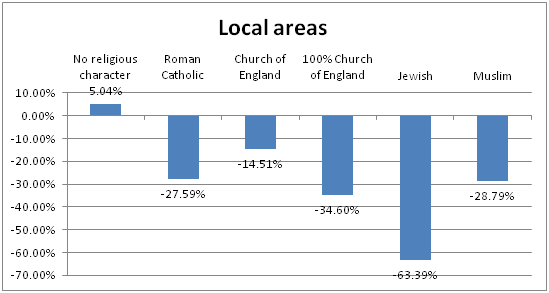
Below we re-present the figures from the FAC’s map:
How much more or less inclusive is each group of school than expected when the schools are compared to their local areas on the basis of free school meal eligibility?
So, to explain what the above table means: schools with no religious character take, on average, 5% more pupils eligible for free school meals than would be expected, given their local area. Catholic schools take 28% fewer, Church of England schools take 15% fewer, Jewish schools take 63% fewer and Muslim schools take 29% fewer. Catholic, Jewish and Muslim schools are invariably 100% religiously selective, when oversubscribed, but in CofE schools this varies widely, so for comparison we also include the figure for 100% selective CofE schools, where we find they take 35% fewer.
(A few housekeeping notes: in this and the following tables we exclude grammar schools, University Technical Colleges and Studio schools, so that we do not have the peculiarities of their admissions policies confusing our comparisons based on religious selection. And what we mean by ‘local’ is that we are comparing each school to the pupils living in its middle super output area (MSOA, a local population cluster consisting of 5,000-15,000 people) and neighbouring MSOAs added until there are more pupils in the local area than in the school. This is explained in more detail in the ‘How are schools ranked on the basis of free school meal eligibility and English as an additional language?’ FAQ in the map.)
Zooming out: comparing each group of schools to wider and wider areas
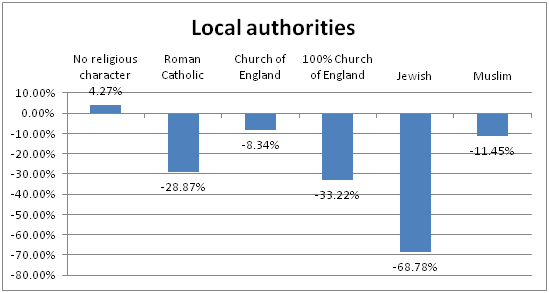
What if we compare each school to wider areas, as the Churches would have us do? Let’s start with the local authority in which each school resides:
How much more or less inclusive is each group of school than expected when the schools are compared to their local authorities on the basis of free school meal eligibility?
Here we see that Church of England schools, as a whole, are looking a bit more inclusive, as are Muslim schools, but they still fall short of being representative of their area. And for Catholic and 100% selective CofE schools there has been no change, while Jewish schools have actually got less inclusive.
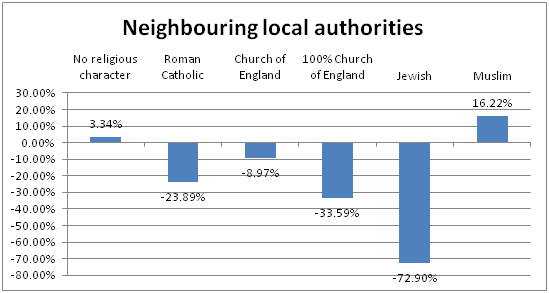
Is this still too close though? What if we compare each school to all the pupils living in its local authority and all neighbouring local authorities?
How much more or less inclusive is each group of school than expected when the schools are compared to their local authorities and neighbouring local authorities on the basis of free school meal eligibility?
Now Catholic schools have got a little more inclusive but not by very much. Jewish schools have got less inclusive still. Muslim schools have got a lot more inclusive. This perhaps reflects the fact that all nine Muslim secondaries are in northern or Midlands cities, where the cities themselves are a lot more deprived than the surrounding countryside. But at any rate, by this point we would argue that we are definitely looking at too wide a geographic area compared to schools’ intake areas.
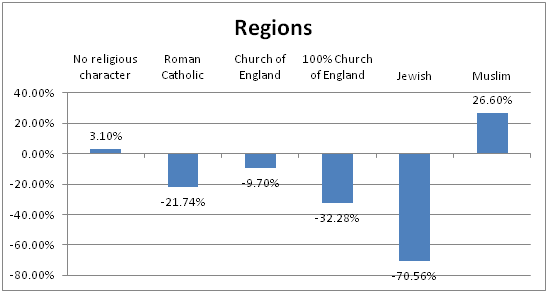
Even so, what if we then compare each school to their regions as a whole?
How much more or less inclusive is each group of school than expected when the schools are compared to their regions on the basis of free school meal eligibility?
We see little change from the chart as above. No-one could argue that schools take from across an entire region (unless they are the London Oratory and Greater London). And yet Catholic, CofE and Jewish schools remain highly uninclusive.
Thus the falsehood of the churches’ defence is demonstrated.
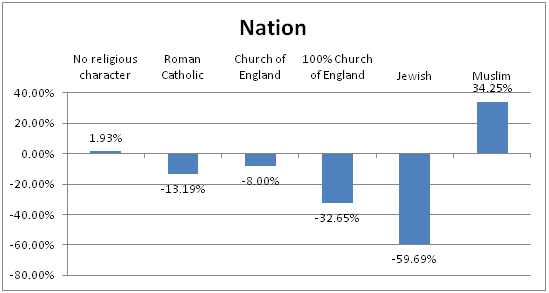
Finally, for completeness, we compare each school to the country as a whole:
How much more or less inclusive is each group of school than expected when the schools are compared to the national as a whole on the basis of free school meal eligibility?
Only here do we see Catholic schools starting to look more inclusive – but still far from fully inclusive. 100% selective CofE and Jewish schools remain decidedly exclusive. But it doesn’t matter. Because schools don’t take pupils from across the country as a whole and to claim that they do is misleading.
 Follow